Ethereum Price Lags Despite All-Time High In Daily Transactions – What’s Next For ETH?
The Ethereum (ETH) blockchain is experiencing a renewed surge in network activity, recently reaching a fresh all-time high (ATH) in daily transactions. However, despite this increase in on-chain fundamentals, ETH’s price continues to trade below major resistance levels, raising concerns that bullish momentum may be fading.
Ethereum Network Activity Picks Momentum
According to a CryptoQuant Quicktake post by contributor CryptoOnChain, Ethereum’s daily transaction count – highlighted in pink in the below chart – has surged to a new ATH of approximately 1,550,000 transactions per day.
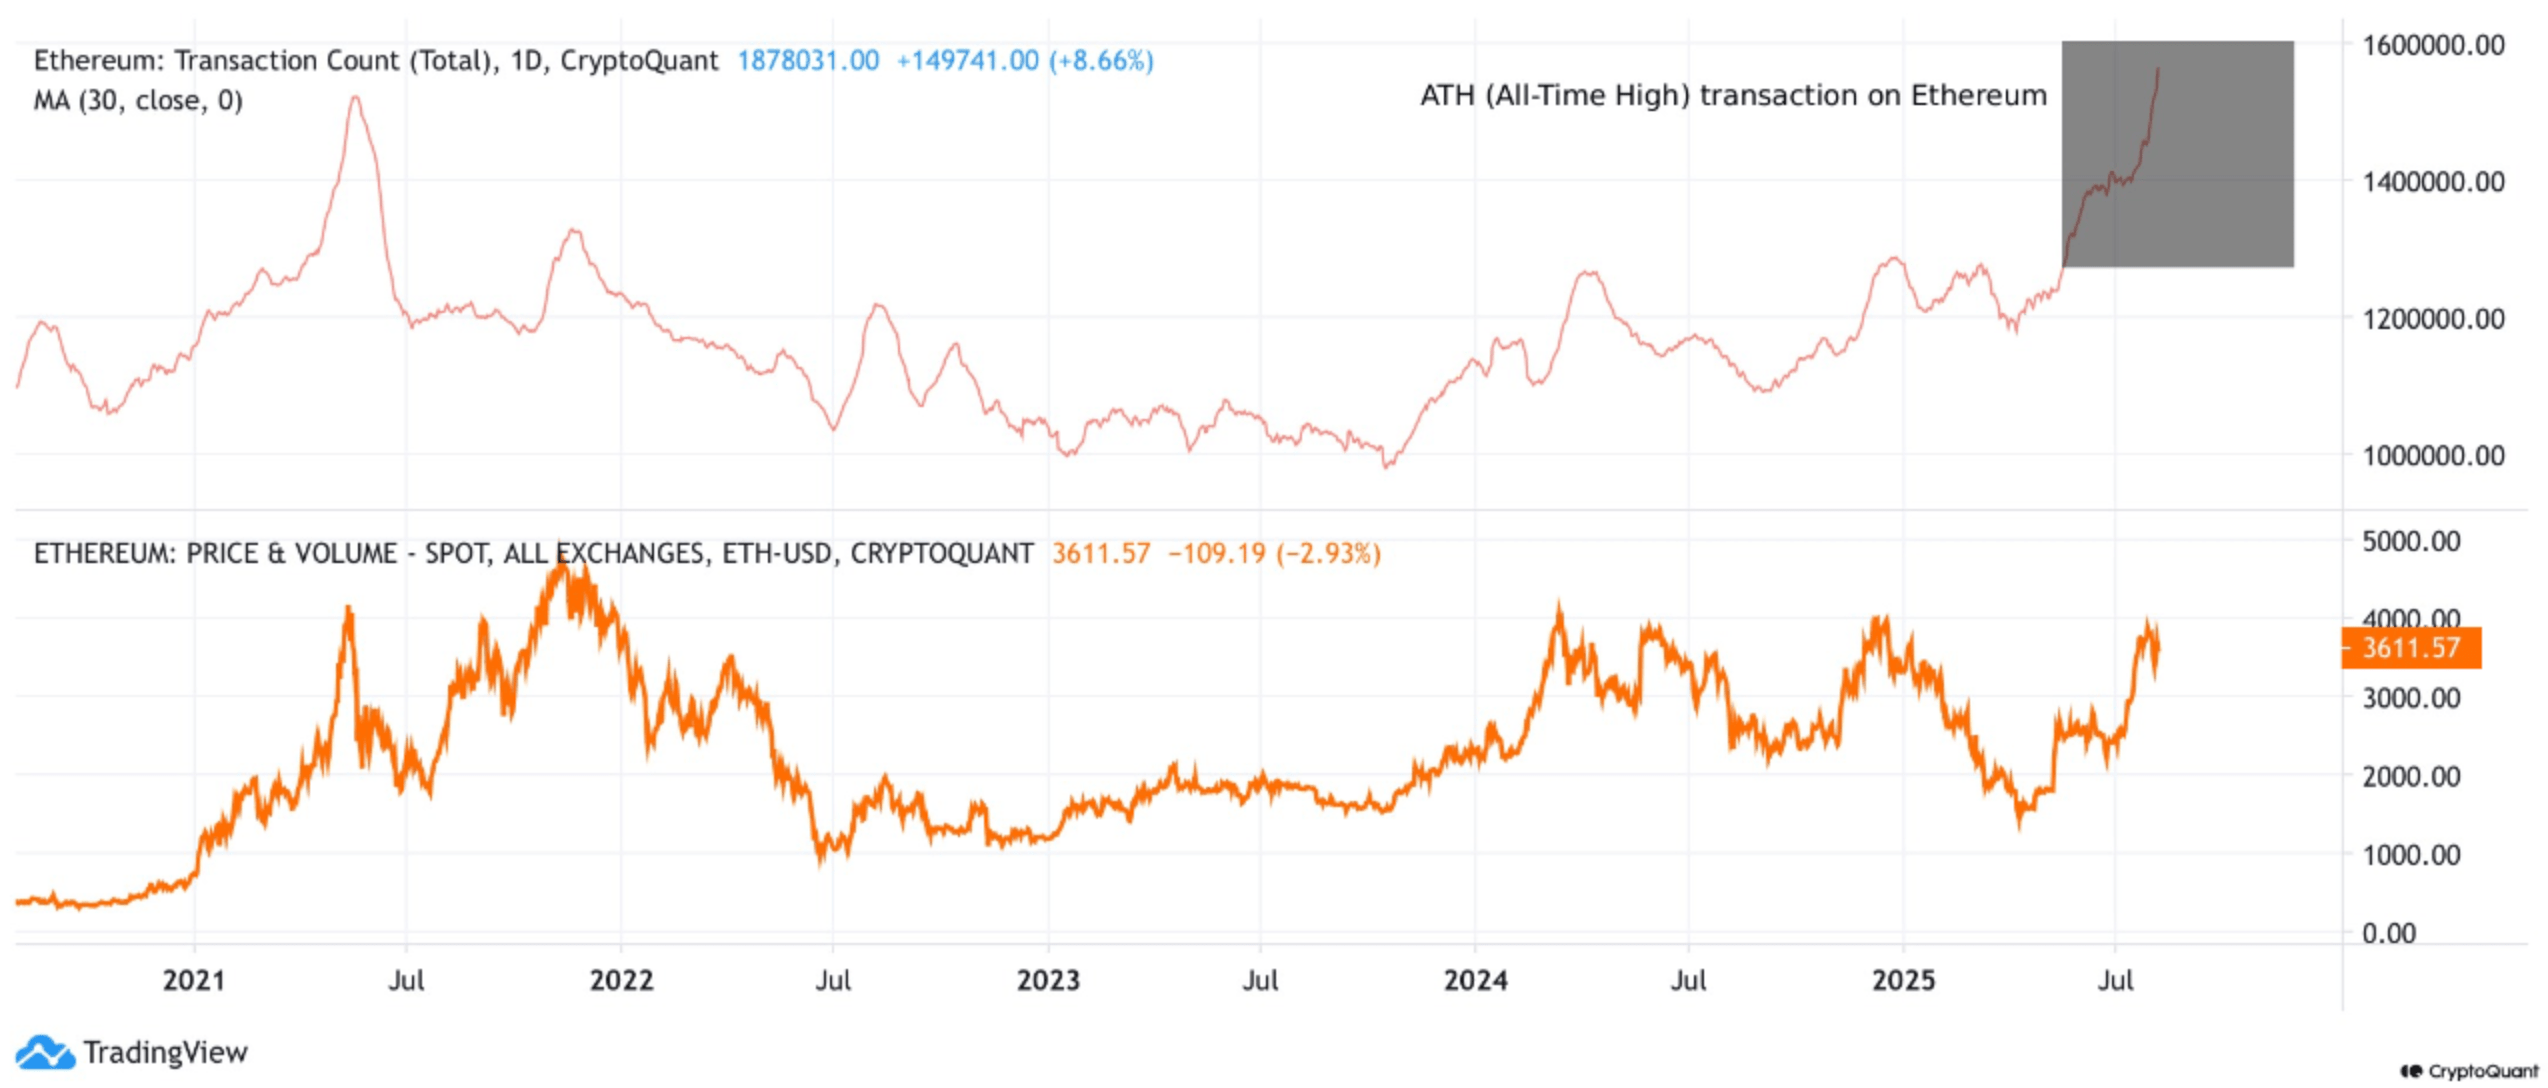
This sharp increase in daily transactions, particularly noticeable over the past few months, points to intensified on-chain usage and overall network engagement. In addition to transaction count, other metrics also reflect a spike in activity – most notably, the number of unique Ethereum addresses.
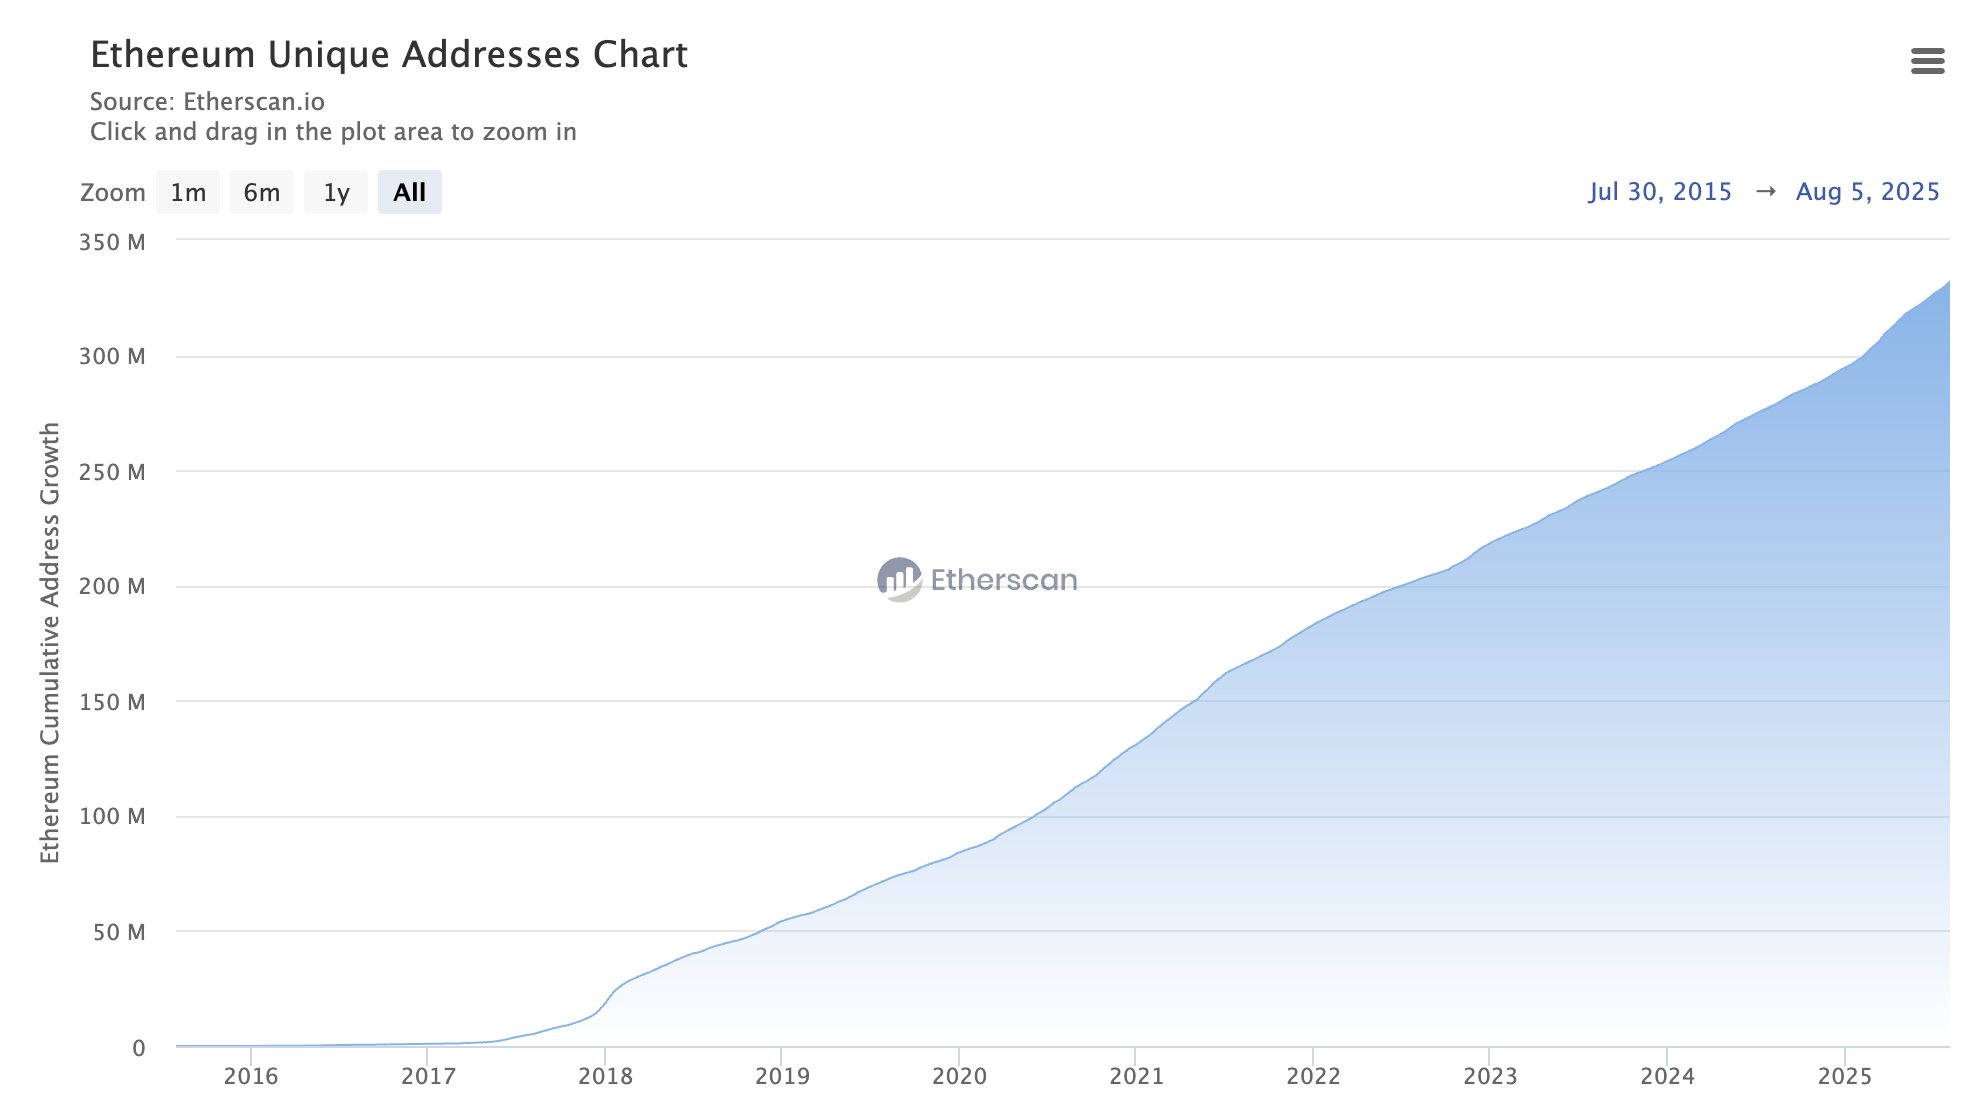
As of August 5, the total number of unique Ethereum addresses stood at 332,122,674, marking an increase of 207,454 new wallets compared to the previous day. While some of these may belong to existing users creating new addresses, the majority likely represent new participants entering the Ethereum ecosystem.
CryptoOnChain emphasized that despite these bullish on-chain signals, Ethereum’s price has not followed suit. As shown in the above chart, ETH’s price – highlighted in orange – remains subdued, failing to break above prior highs or key resistance zones.
This disconnect between rising network fundamentals and lagging price action may indicate that the market is in an accumulation phase, the analyst said. CryptoOnChain further suggested that Ethereum could be setting the stage for a significant bullish breakout, with potential upside targets reaching as high as $5,000.

Is ETH Price Headed For A New ATH?
In a separate analysis posted on X, crypto analyst Titan of Crypto shared the following ETH monthly chart, noting that the asset is “compressing within a massive monthly triangle.” According to the analyst, a successful breakout from this pattern could potentially drive ETH toward $8,000.
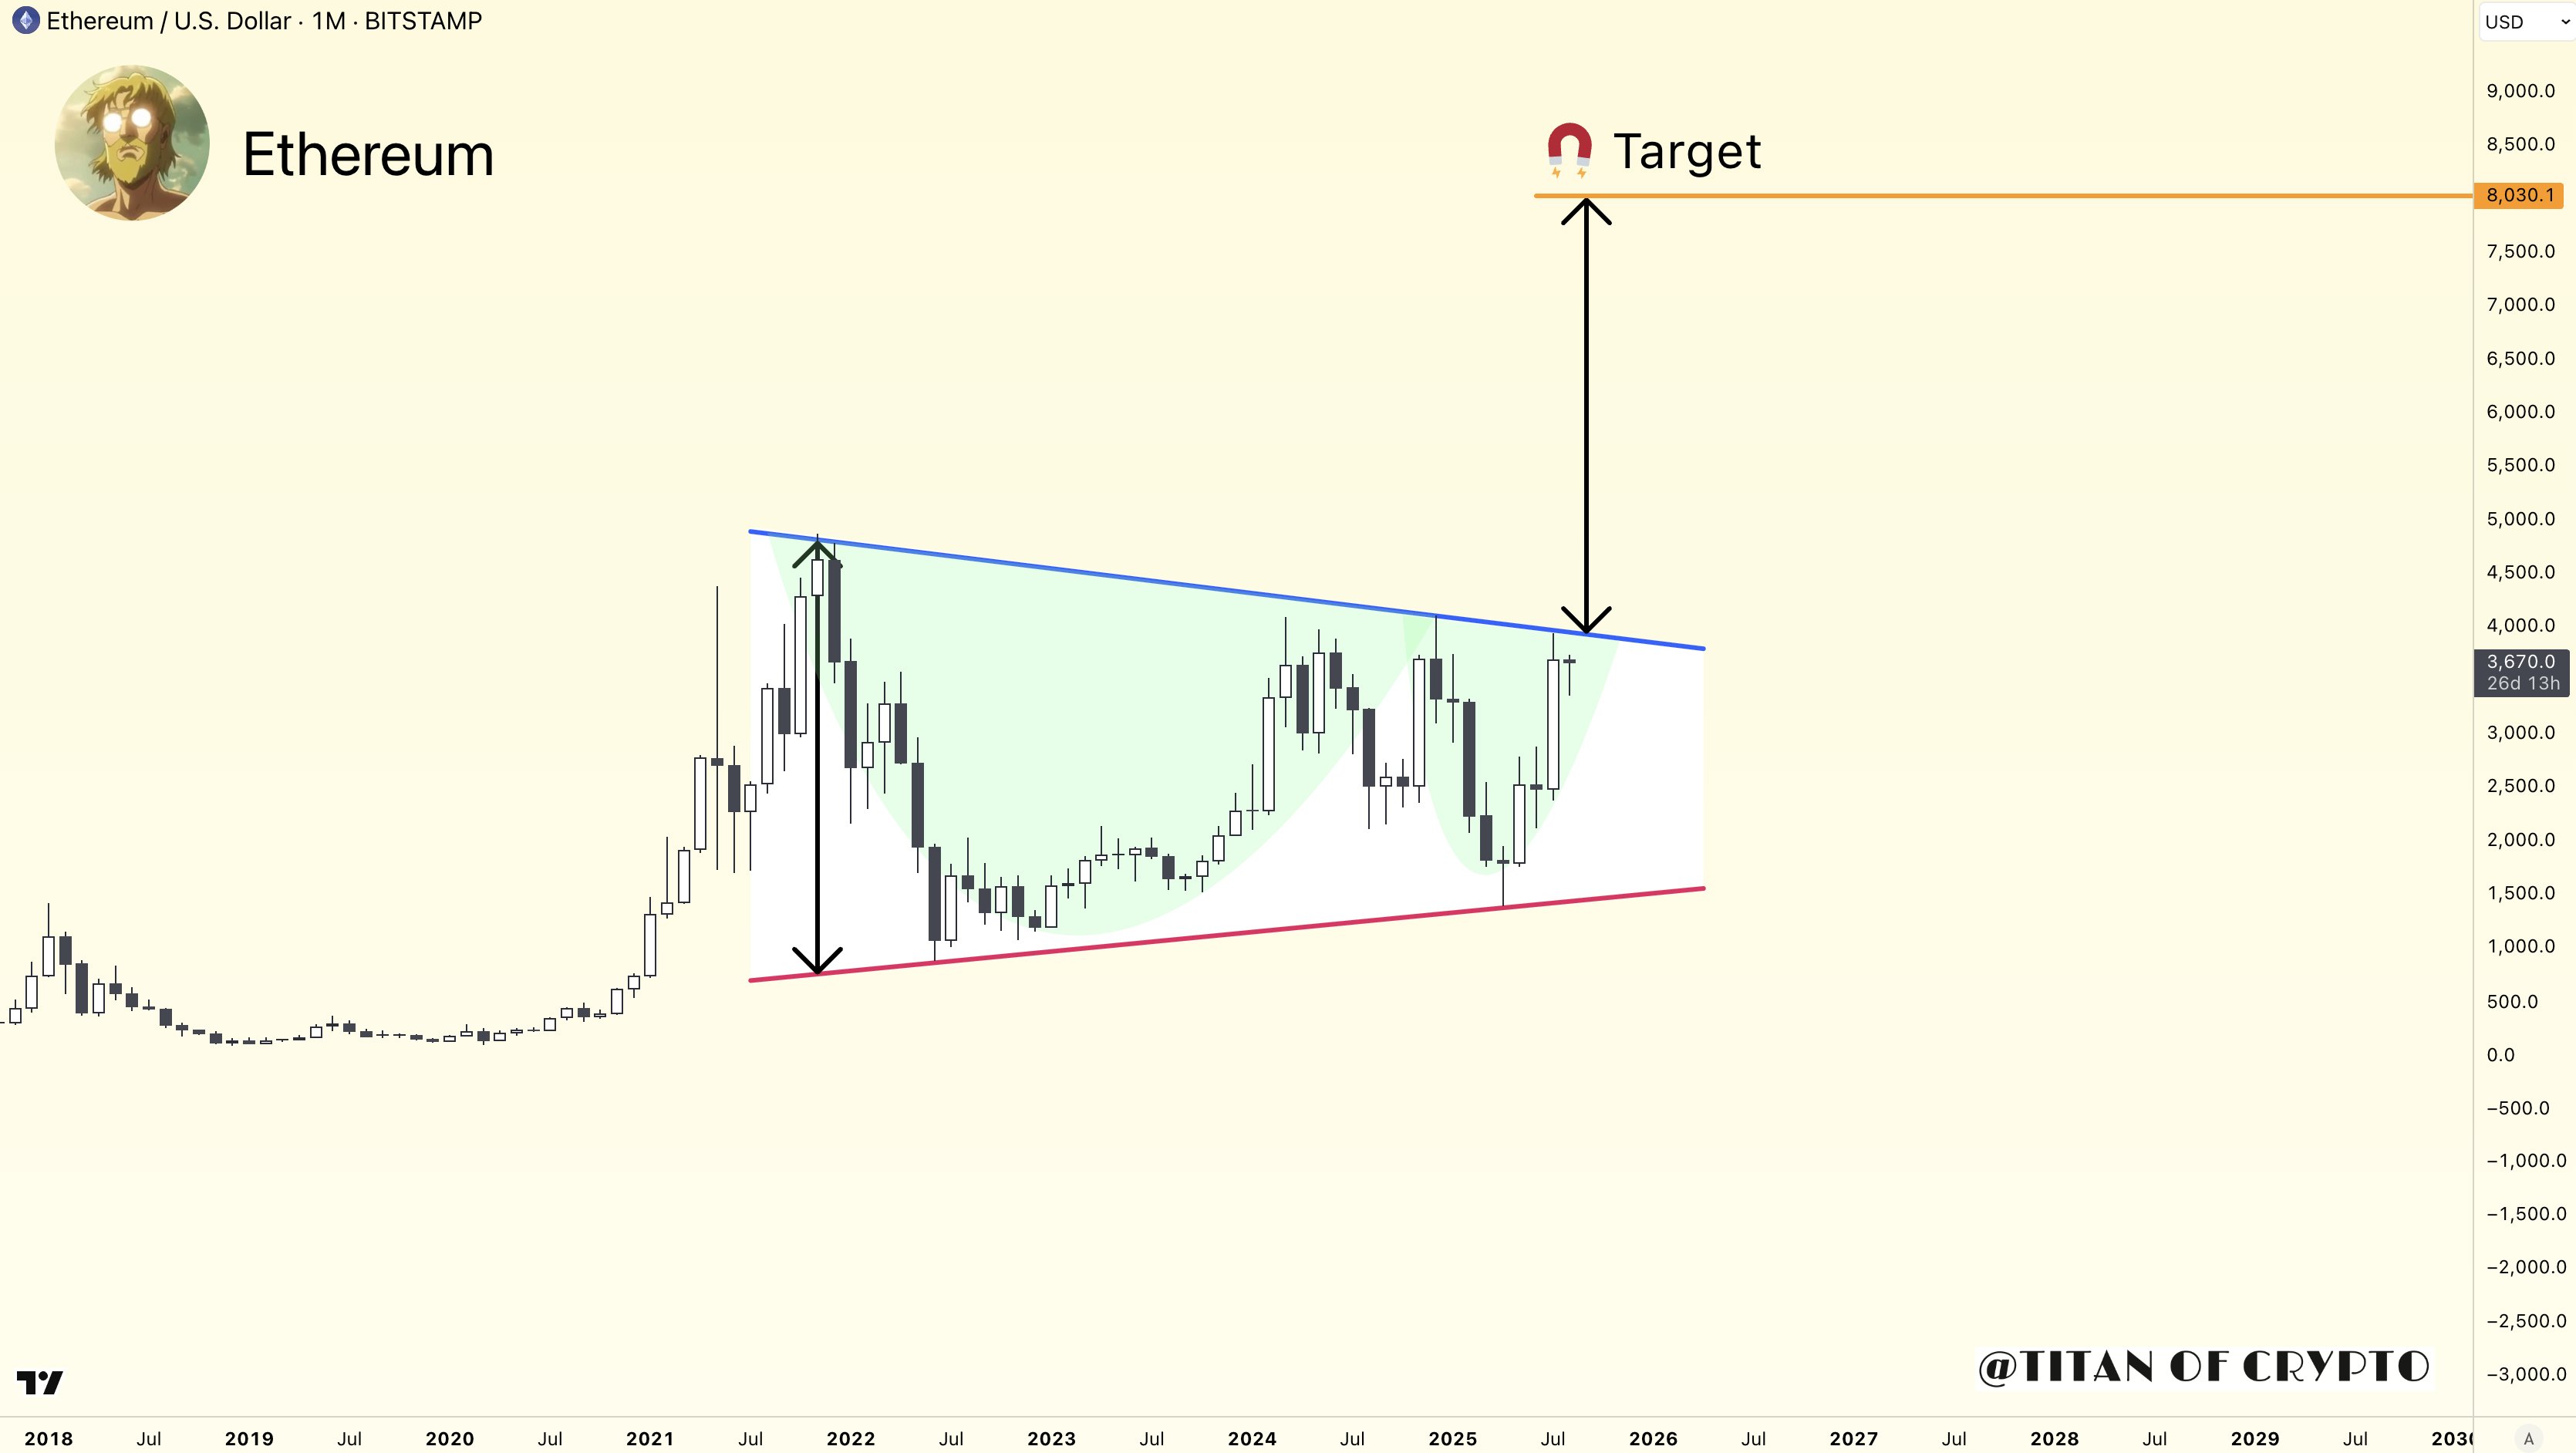
For the uninitiated, the triangle pattern is a chart formation that occurs when price action consolidates between converging trendlines, forming a shape that resembles a triangle. It typically indicates a period of indecision that often resolves with a breakout in the direction of the prior trend, signaling continuation or reversal depending on the context.
Another well-known analyst, Gert van Lagen, echoed a similar outlook. He noted that ETH may be positioning for a powerful breakout, with a projected price target of up to $9,000, citing growing technical and fundamental support.
Meanwhile, on-chain exchange data also supports a bullish narrative. Over the past two weeks, more than 1 million ETH has been withdrawn from centralized exchanges – fuelling speculations about a potential supply crunch. At press time, ETH trades at $3,590, down 1.1% in the past 24 hours.
